应用LI-7825 高精度 CO2 同位素/NH3 分析仪判断气体来源更容易
Dave Lowry是英国伦敦皇家霍洛威大学 (RHUL, Royal Holloway University of London) 的稳定同位素地球化学家,最初在英国从事沉积物矿化研究,他的早期工作主要是关于磷酸对碳酸盐的分解问题。
20 世纪 90 年代后期,他投身于大气科学领域,协助欧盟进行甲烷排放的特征分析。当时的测量使用的是质谱仪。近年来,他致力于开发新技术,将 δ13C纳入测量范围。这些年,Lowry 博士和他的同事们采集了大量的 CO2 数据,但是由于尚不了解其来源以及来源特征,因而未能充分获取其所蕴含的信息。
来源特征是气体来源的可衡量指标,可由同位素分析得到。这就为 LI-7825 高精度CO2 同位素/NH3 分析仪清晰的展现出了科研用武之地。
为解决上述问题,Lowry 博士对 LI-7825 原型机进行了测试。接下来,我们将为您讲述他的测试过程、测试结果、以及广泛应用 δ13C 测量所能带来的新的科研机会。
老橡树
伦敦皇家霍洛威大学办公室最初安装空气采样管线时,附近的老橡树并未引起人们的注意。当时,研究人员只对甲烷感兴趣,二氧化碳气体并非关注点。直到 CO2 气体分析仪也连接至这条采样管线上,事情开始变得有趣起来。在一个温暖的春日,橡树的嫩芽绽放时,研究人员观察到 CO2 浓度突然急剧下降。
尽管 CO2 浓度的变化幅度出乎意料,但这些测量并非没有意义。这些观察促使研究人员开展实验,去试图测量树木对于大气同位素特征的影响。 Dave Lowry 博士观察到: CO2 浓度的昼夜周期变化十分明显,以及光合作用对CO2的强烈吸收效应和空气中 δ13C 的负向偏移,表明树木正在消耗空气中的 13C 。
森林研究站
Lowry 博士在森林研究站测试 LI-7825 分析夜间时段的 CO2 数据,目的是识别其源特征。他观察到夜间峰值与日落前的傍晚峰值差异显著,要更宽、更低。当数据的取平均值时间段优化至10秒时,便呈现出最有趣的特征,可以看到 δ13C 的傍晚峰值为 -31‰ 夜间峰值为 -19‰。 尽管这一差异的原因以及来源尚不明确,但他认为机动车排放的可能性最大。实验地点位于英格兰南部相对偏远的地区,但仍可能受到晚高峰的影响,可能在未来这会成为一个研究课题。
移动测量
实验地点位于英格兰西北部,附近有奶牛场和垃圾填埋场的已知 CO2 和 CH4 排放源,研究团队将LI-7825架设在汽车移动平台上进行调查式测量。
该平台测量的是单路气流,配备了 LI-7825 用于测量 CO2 和 δ13C;以及 LI-7810,用于测量甲烷。
通过测量垃圾填埋场下风向的 CO2 同位素气体,可以明确识别其来源特征。移动平台在垃圾填埋场附近的测量效果良好;但由于奶牛在室内,奶牛场的测量数据并没有这么清晰。不过研究团队预计,当牲畜在户外时能够测量到更强的来源特征。
仪器对比
除了野外和移动测量, Lowry博士团队还评估了已知标准气体的测量结果。他们在伦敦西部特丁顿的国家物理实验室对某种标准气体进行了测量,该标气的 13C 浓度为 -41.9‰。LI-7825 三点校准后的测量偏移量 <0.1‰ ,Lowry博士称其 “不负所望” 。
之后,团队对比了 LI-7825 和Picarro G2201i的测量数据。 空气样品采自伦敦帝国理工学院屋顶的抽气口。数据显示,当风向由南偏东转至南偏西时, CO2 浓度出现周期性峰值,同时 13C 浓度降低;峰值持续30 秒,出现间隔为42-43 分钟。经推断,Lowry博士确定数据表明附近有锅炉定时启动和排放气体。
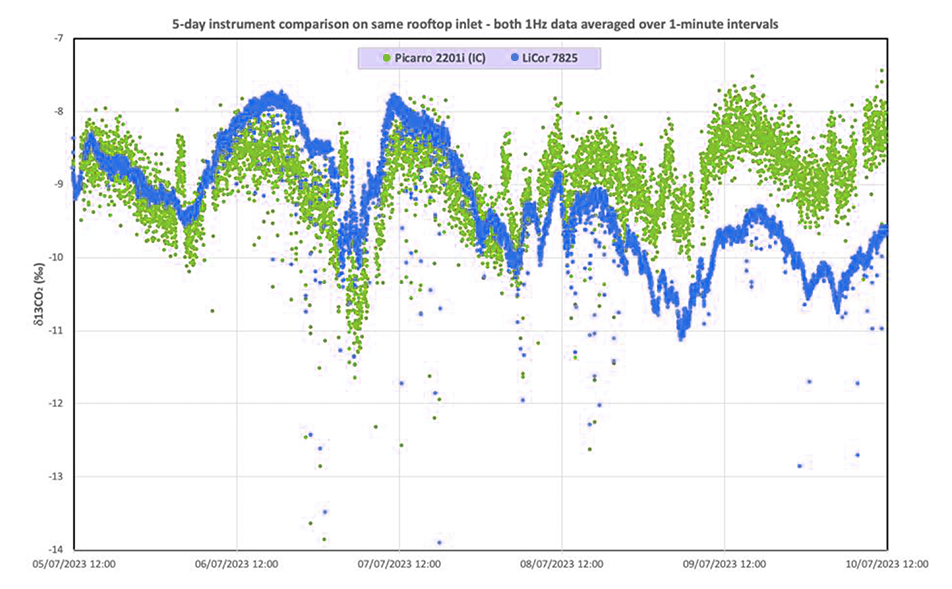
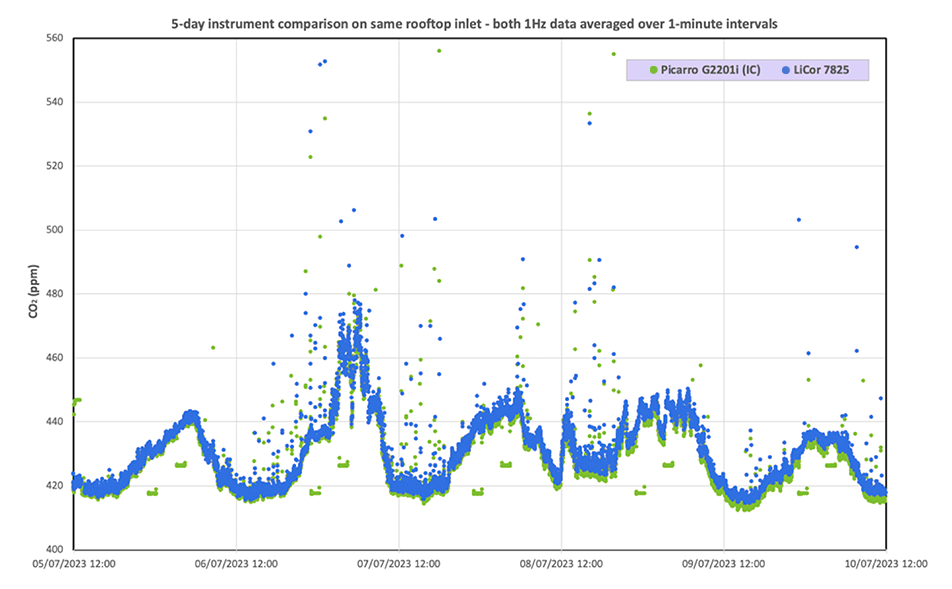
View Data
Lowry博士评估之后指出,LI-7825的 δ13C 测量性能符合其标称技术参数。LI-7825测量期间若进行定时校准和零位调整,其噪声低于对比产品。
LI-7825 的设计旨在通过测量成本低、测量精度高以及便携性好,来推广 CO2 同位素测量的应用。识别 CO2 的来源曾经是个难题,但是随着 CO2 同位素测量的广泛应用,解决这个问题将变得容易,CO2 溯源数据有助于人类做出更好的气候变化和CO2排放决策。
Lowry博士是稳定同位素地球化学家,就职于英国伦敦大学皇家霍洛威学院 (RHUL)。
请联系北京莱阔生物科技有限公司,了解LI-7825高精度 CO2 同位素/NH3 分析仪的详细信息。